The Weekly Tearsheet: Predicting the Fed's next move
Last week was relatively uneventful as we had little economic data to work with and the Fed is in the quiet period ahead of the June 15-16 FOMC meeting. The Fed Funds futures are still leaning towards the Fed standing pat at the meeting, with a 70% probability of no hike and a 30% chance of a 25 basis point hike. That said, the markets don’t see a June pause as a signal the Fed is done; the July meeting sees a 70% chance for at least a 25 basis point hike. For the end of the year, the market is predicting that the Fed Funds rate will be where it is right now. Not too long ago, the markets were pricing in an easing.
We will get the Consumer Price Index report on Tuesday before the Fed makes its decision. The Street is looking for a 0.2% month-over-month increase in the headline rate and a 4.1% year-over-year increase. If you strip out food and energy, the Street is looking for a 0.4% month-over-month increase and a 5.3% annual increase. Since real estate prices peaked in June of 2022, this should be the last month we see inflation being driven by housing. Inflation going forward is being driven mainly by services ex-housing, which is basically wage growth. You can see that component of the CPI in the chart below:
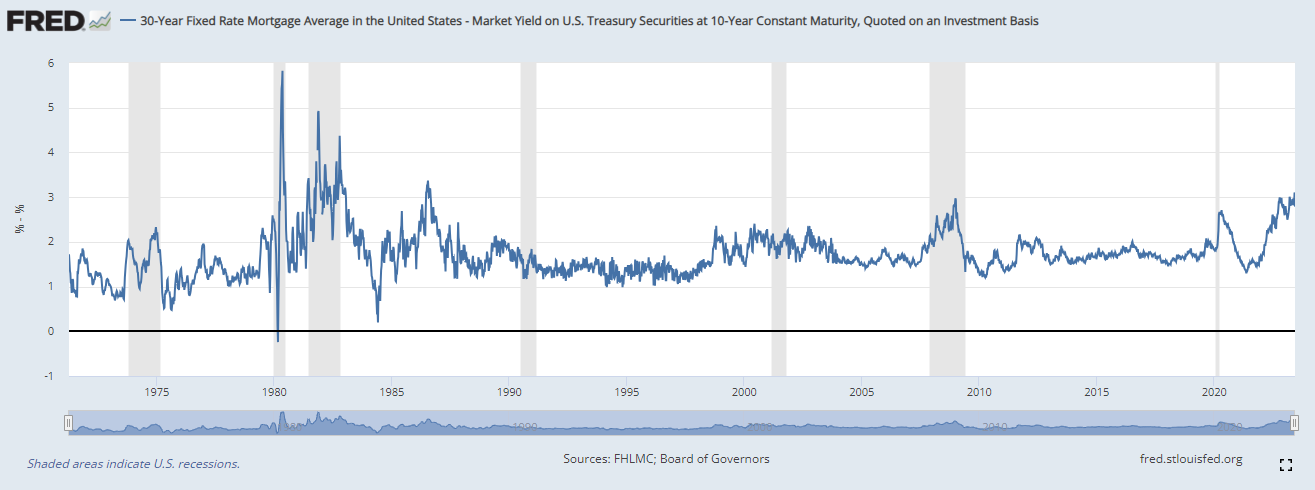
Rising rates are not helping things for companies in the mortgage business, but rising rates are only half the story. The other part is mortgage backed security (MBS) spreads, which are a big reason why mortgage rates are so high. Fed uncertainty is probably a big driver of wider MBS spreads. MBS spreads basically are the the incremental return that MBS investors require over and above the risk free rate. Without getting too deep into the weeds with option-adjusted spreads, you can use the difference between the 30 year fixed rate mortgage and the 10 year bond as a proxy.
As you can see in the chart above, MBS spreads are back at levels last seen during the Reagan Administration. Fed uncertainty is a big driver of spreads because mortgage backed securities exhibit a behavior called negative convexity. This means that when rates go up, MBS fall in value. But when rates fall, they go up, but that increase eventually gets capped. Nothing will prevent a MBS from falling to 70 from par. But you aren’t going to see a MBS go to 130. They cap out around 109 or so.
The reason for this is prepayment risk, which means that the borrower has the option to repay the mortgage early. This means the MBS holder is short an option, and volatility makes options worth more. That uncertainty is one of the big drivers of MBS spreads IMO.
The other explanation we hear a lot of is QT or quantitative tightening. The argument goes that the Fed purchased a lot of MBS (about $2.7 trillion worth) in their efforts to stimulate the economy. Now that the Fed is letting its MBS portfolio run off, that demand no longer exists. The interesting thing about that theory is that you can look at the chart above and see that all of the Fed’s MBS purchasing didn’t make that dramatic of an improvement in MBS spreads.
In the 1990s, MBS spreads averaged 145 basis points. This means that if the 10 year bond yield was 7%, you could expect to pay 8.45% on your mortgage. From 2000 through 2006, MBS spreads were 178 basis points. From 2009 to 2020 (the quantitative easing years), MBS spreads averaged 168 basis points. Today, they are around 300 basis points. If we consider normalcy to be around 160 basis points, we could see a 140 basis point decrease in the 30 year fixed rate mortgage, without requiring any help from the 10 year Treasury.
Will this be enough to salvage 2023 for the mortgage industry? Probably not. ATTOM data estimates that $388 billion in originations were done in Q1, which is a 20 year low. The rate lock volume indices seem to indicate that instead of the expected seasonal increase, volumes are down in April versus March.
While the Fed Funds futures are not looking supportive for the rest of 2023, the December 2024 Fed Funds futures see about 150 basis points in rate cuts next year.
With the June FOMC meeting, we will also get another set of economic projections and another dot plot. At the March meeting, the most common end-of-2023 forecast was for the Fed Funds rate to be between 5% and 5.25%. There were a few members who thought that rates would be higher, and one that thought rates will be lower. I suspect the dot plot will be the focus much more than what the actual statement says. If the Fed gives an all-clear signal then the dot plot should confirm that - in other words, we shouldn’t see an end of 2023 Fed Funds forecast higher than current levels.
The Fed envisioned 2023 GDP to come in around 0.5% growth. GDP was 1.3% in Q1 and the Atlanta Fed GDP Now Index sees Q2 coming in at 2.2%, so it will be interesting to see if the Fed takes up their GDP forecast. They see unemployment rising to 4.5% by the end of the year, and that looks too high as well. That said the debt ceiling deal includes a resumption of student loan payments, which means that one big supporting factor for consumer spending will be removed. Still, I think that if the Fed is taking up their GDP forecast and down their unemployment forecast then they will be reluctant to signal that they are done hiking rates. Unfortunately.


